 Remember Tucker Carlson? Remember how much of a boor he was to a Canadian MP while she was trying to discuss US-Canada relations? (If you don’t, click here and skip forward to 2:12). Well, CNN just fired him, and it looks like Jon Stewart’s appearance on Crossfire was the final nail in the coffin. The full story is available over at the CBC.
-
-
O Canada
 Just got back from listening to Canadian, er, I mean World Junior Men’s Hockey Championship at Darren’s with Cam. We were tuned in to Fan 960, a Calgary radio station, which was broadcasting the Grand Forks, North Dakota-based game via the Internet.
Canada clobbered Russia 6-1. What can I say besides “Woohoo!”? Someone get the dustpan ’cause I hear a SWEEP. 🙂- CBC Sports Online: Canada crowned world champs
- TSN (CP): Canada wins first WJHC gold since 1997
- CTV: Team Canada wins hockey gold, beats Russia 6-1
- ESPN (AP): Canada wins first title in 8 years
- StarTribune: World Junior Hockey title: Canada 6, Russia 1
Related:
-
The price of gas and politics
So for a while now, I’ve been keeping track of how much it costs me to buy gas, and the average distance between fill-ups. The idea being, that, after a while, I can characterize the performance of my car.
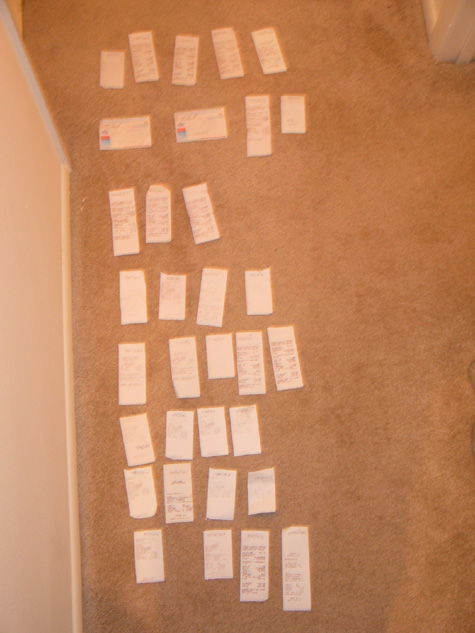
(Ugh… forgive the crummy photo, I only wanted to get the idea across.. but in case that didn’t happen… those are gas receipts…. 🙂
I decided it would be good to update the Excel spreadsheet again (last time was November 2003).
The results? Since October 2002, I’ve filled up my tank 74 times. On average, I drive 235 miles between fill-ups, put in 9.735 gallons of gas, and spend $16.26 doing so (a rate of $1.625/gallon). That’s an average gas mileage of 24.13 miles/gallon. Okay, but not great by any means. (For comparison purposes, the car is a compact sedan from 1995.)
I plotted a few graphs with the data, but the most interesting one was price/gallon vs. time. There were a few very solid peaks and valleys in the graph. Which of course got me wondering about the influence of the political situation on the gas prices. So I went out and found a timeline of events in Iraq. A few timelines, actually, since none of them had all the dates I needed. Anyhow, the result is below; click on it for a bigger version. Breaks in the line are where I’d lost a receipt.
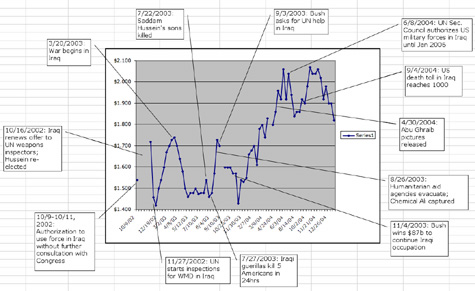
So, as the go-ahead is given for war or continued occupation, the price of gas goes down. It goes up again as casualties rise. Not too surprising, I guess 🙂
References:
 Just got back from listening to Canadian, er, I mean
